example of MSP security report with structured client insights
For MSPs Who Want Predictable Security Revenue

Grow security MRR.

Structure your packages, accelerate deal cycles, and grow predictable recurring revenue - without adding more tools or complexity.

Built specifically for modern MSPs selling security as a revenue engine.

Radar chart displaying security posture with NIST components Identify, Protect, Detect, Respond, and Recover, showing current and predicted scores, plus projected CyberResilience at 85% and CyberScore at 58.
FROM DATA TO DECISION

When security is clear
upgrades get approved.

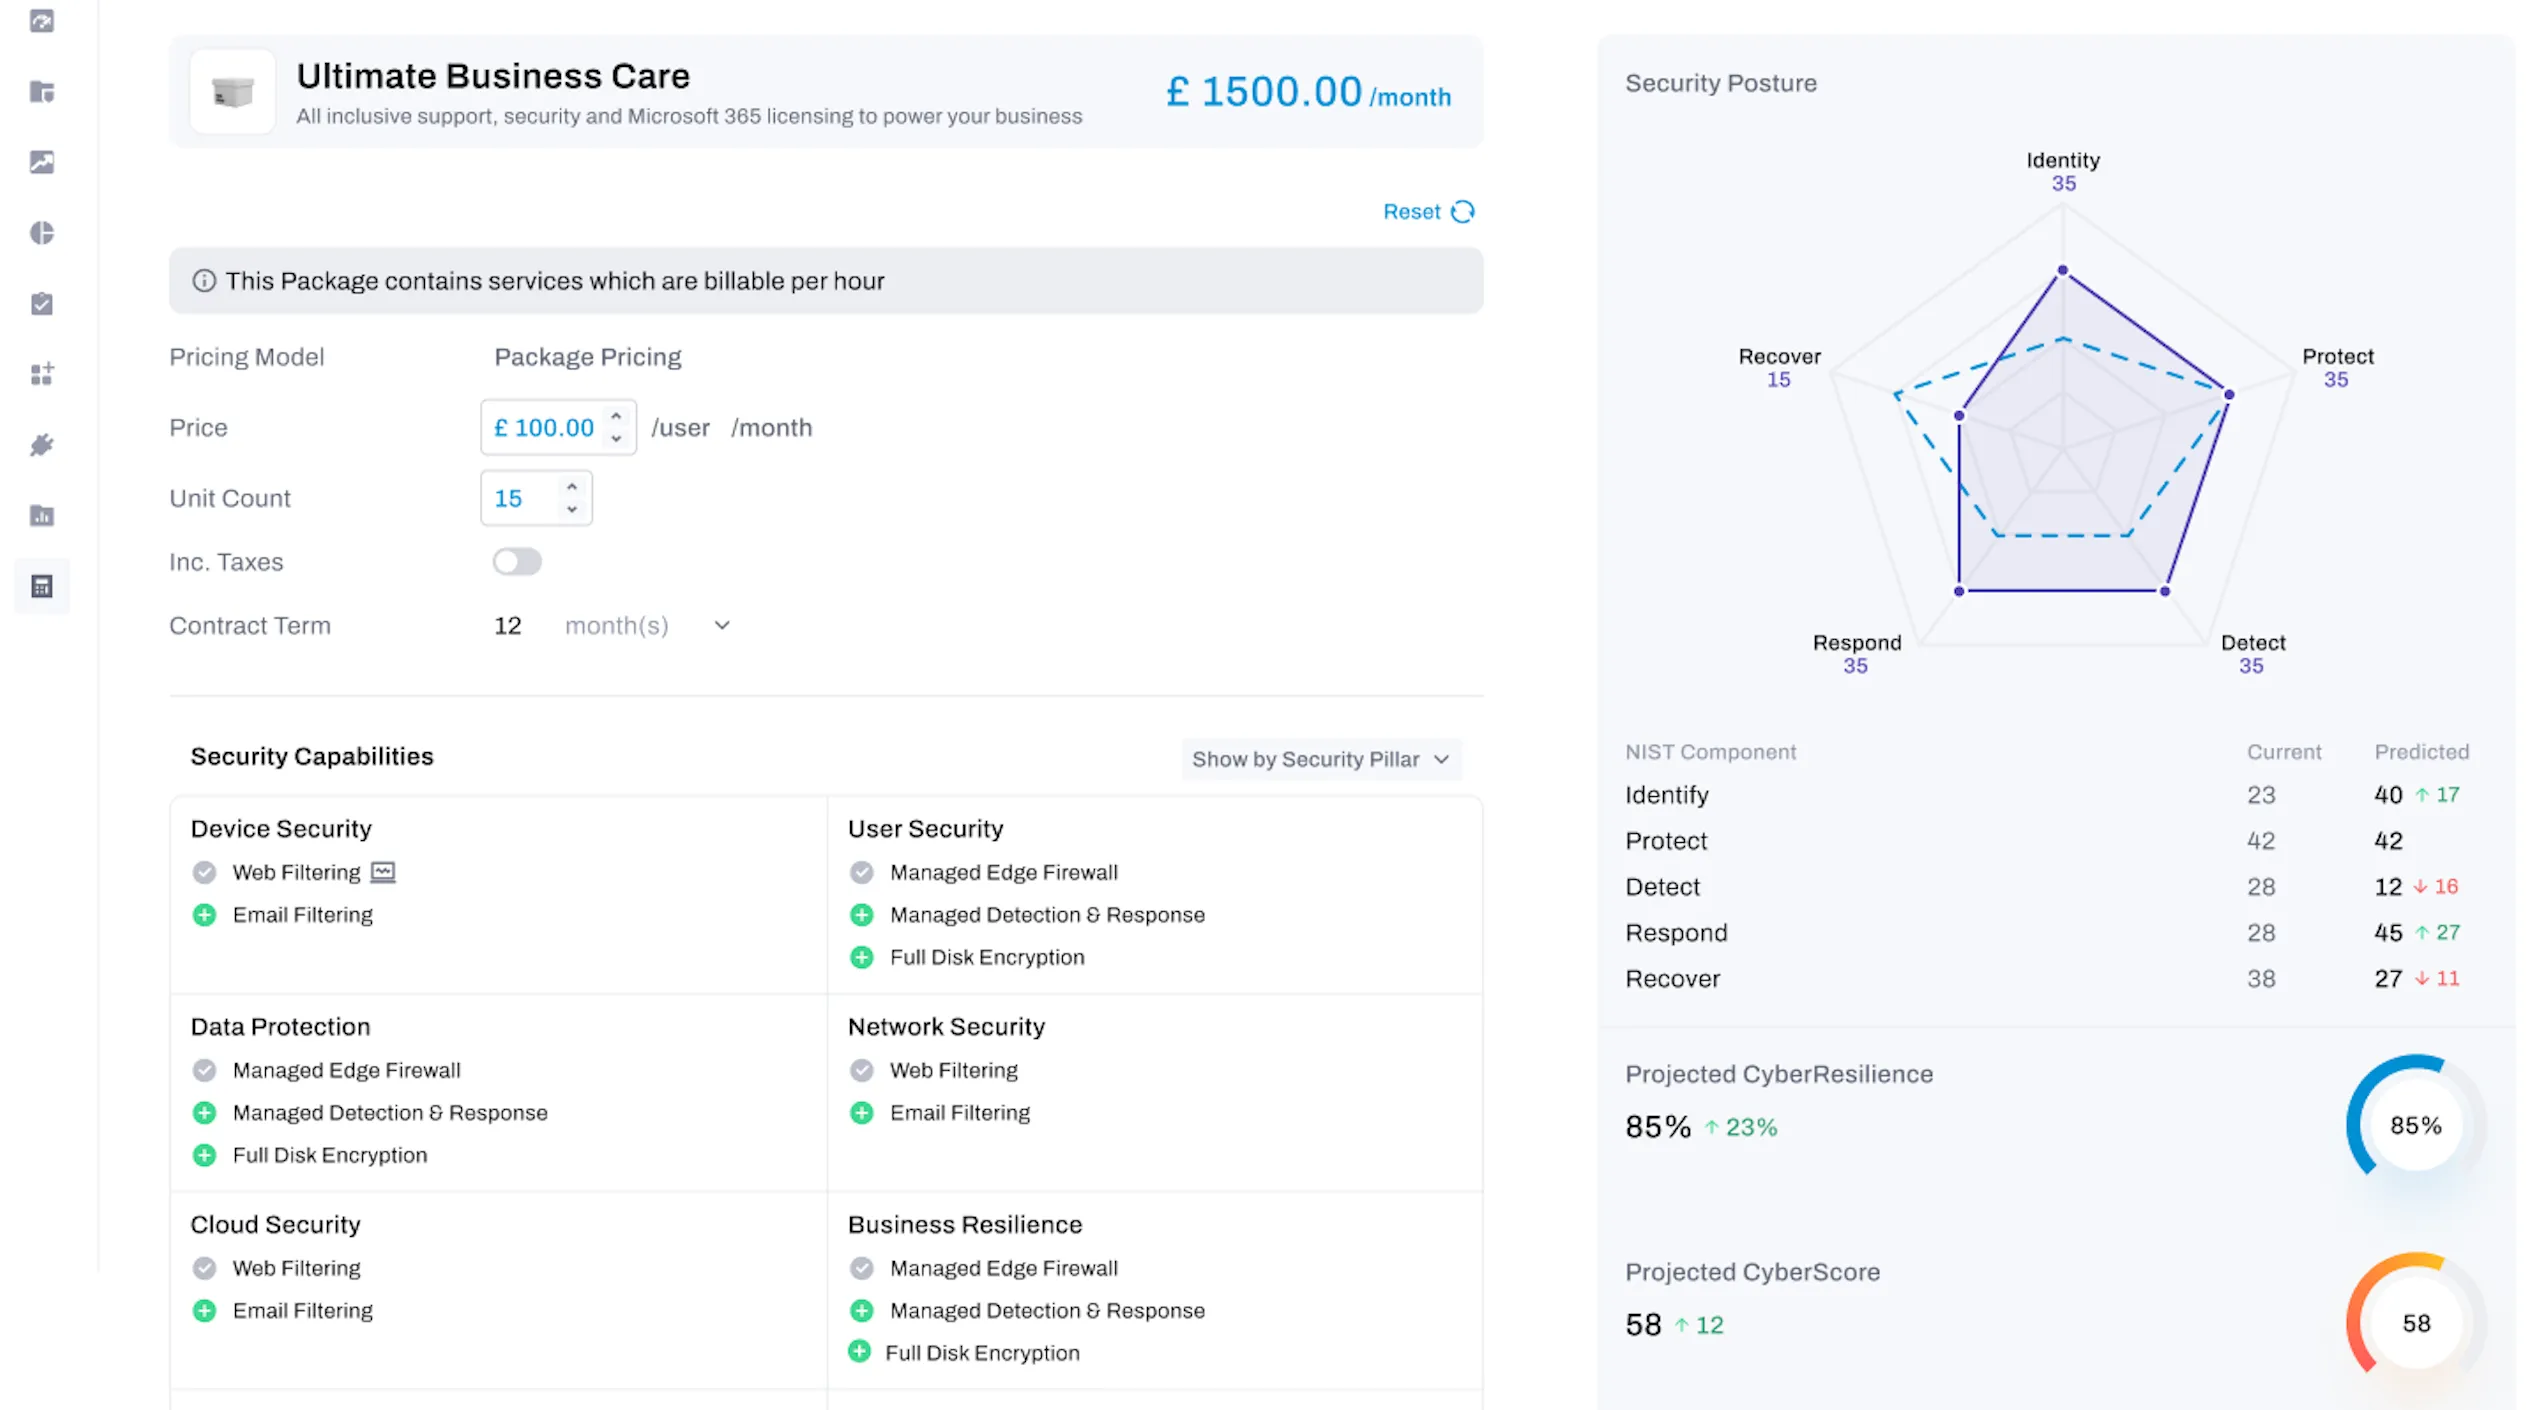
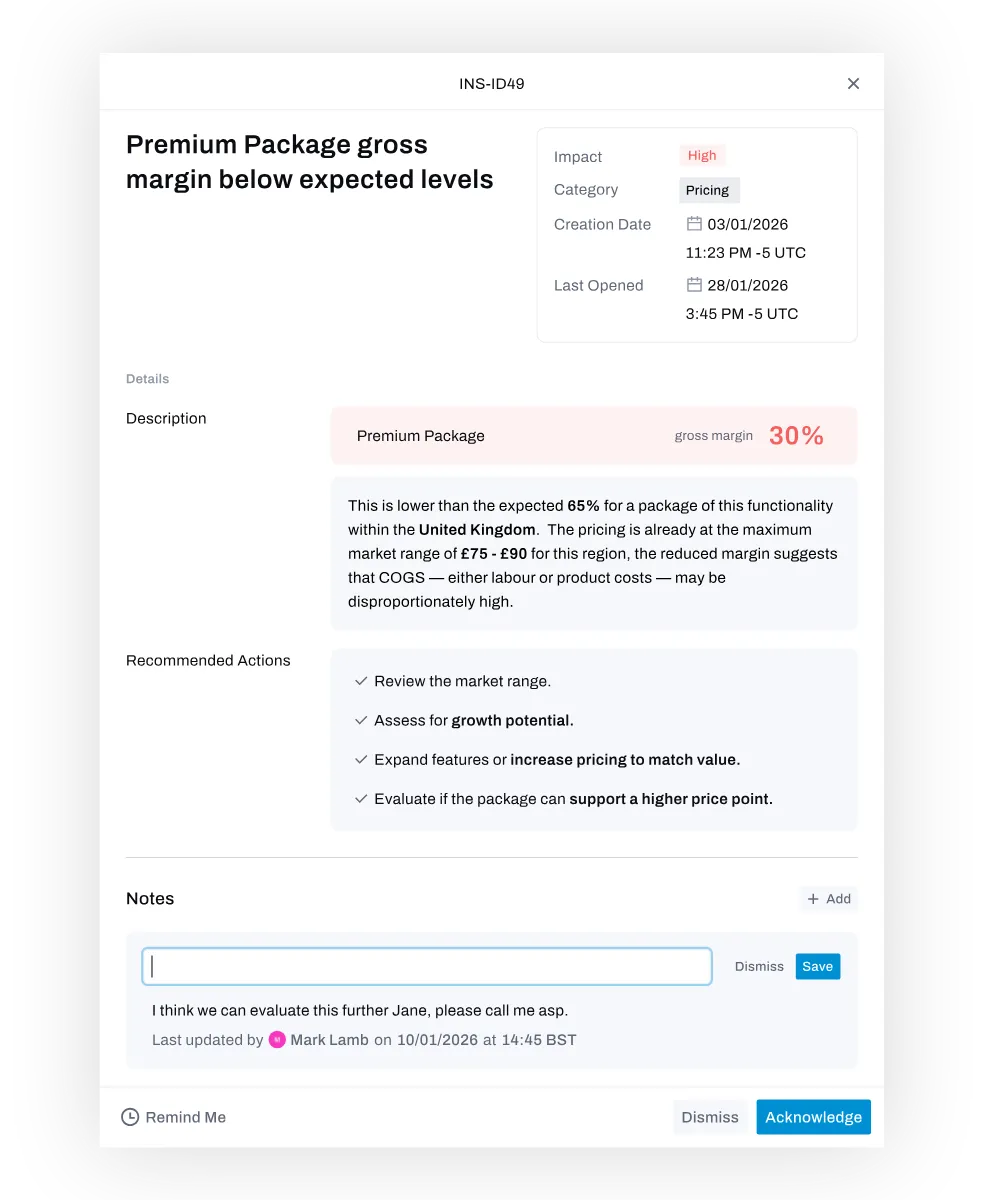
HighGround turns complex security data into clear, structured insight that business owners understand. No jargon. No noise. Just risk, impact, and what to do next.

Security Your Clients Actually Understand

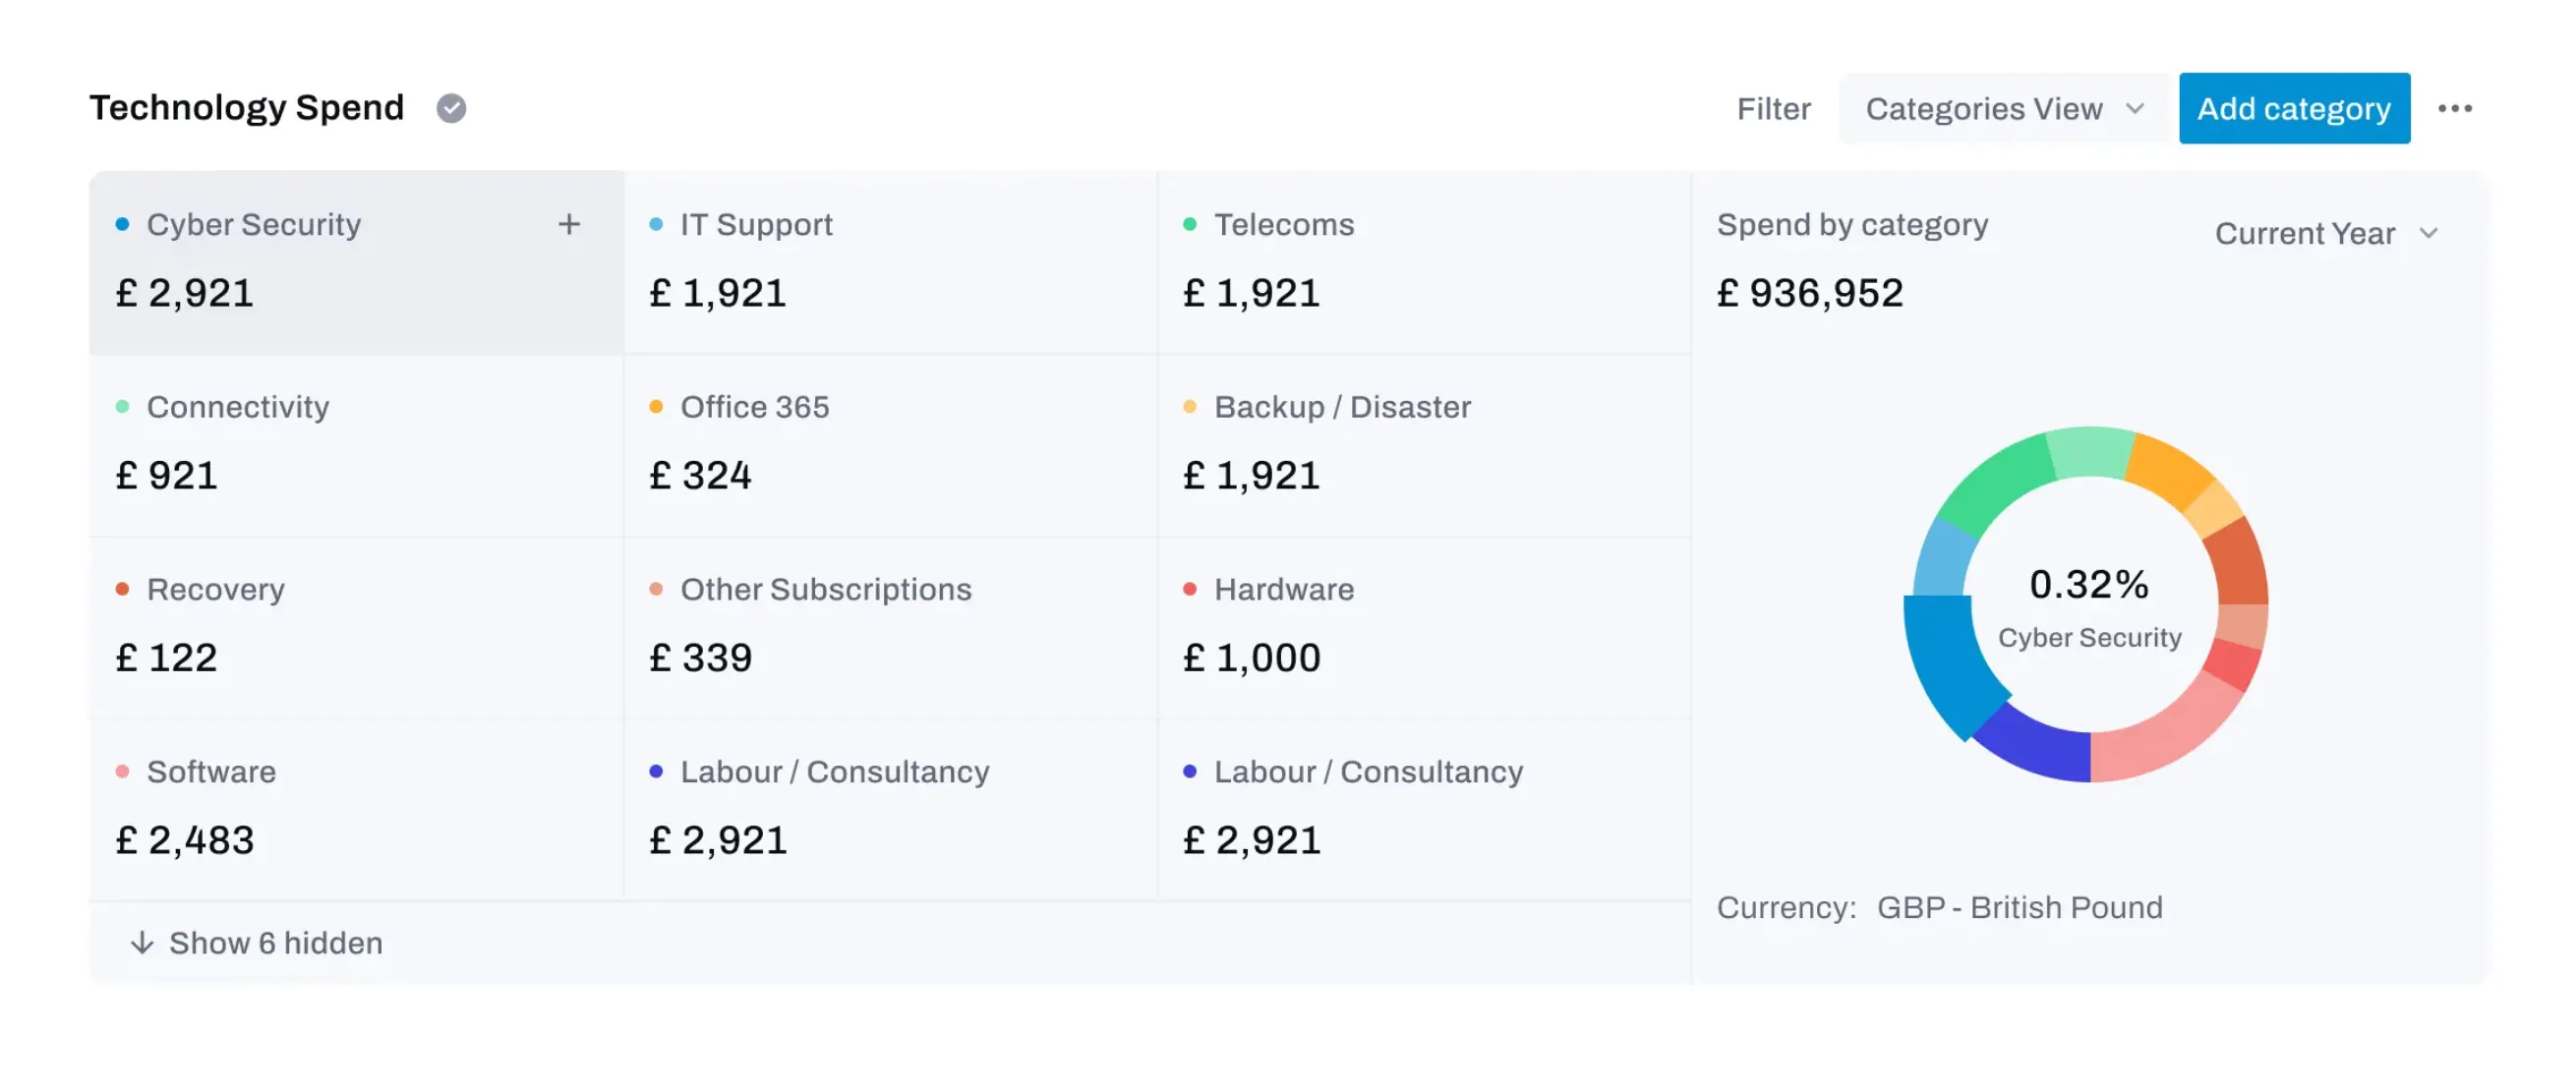
Security, risk, and spend — explained in plain business terms.

From Insight to Upgrade

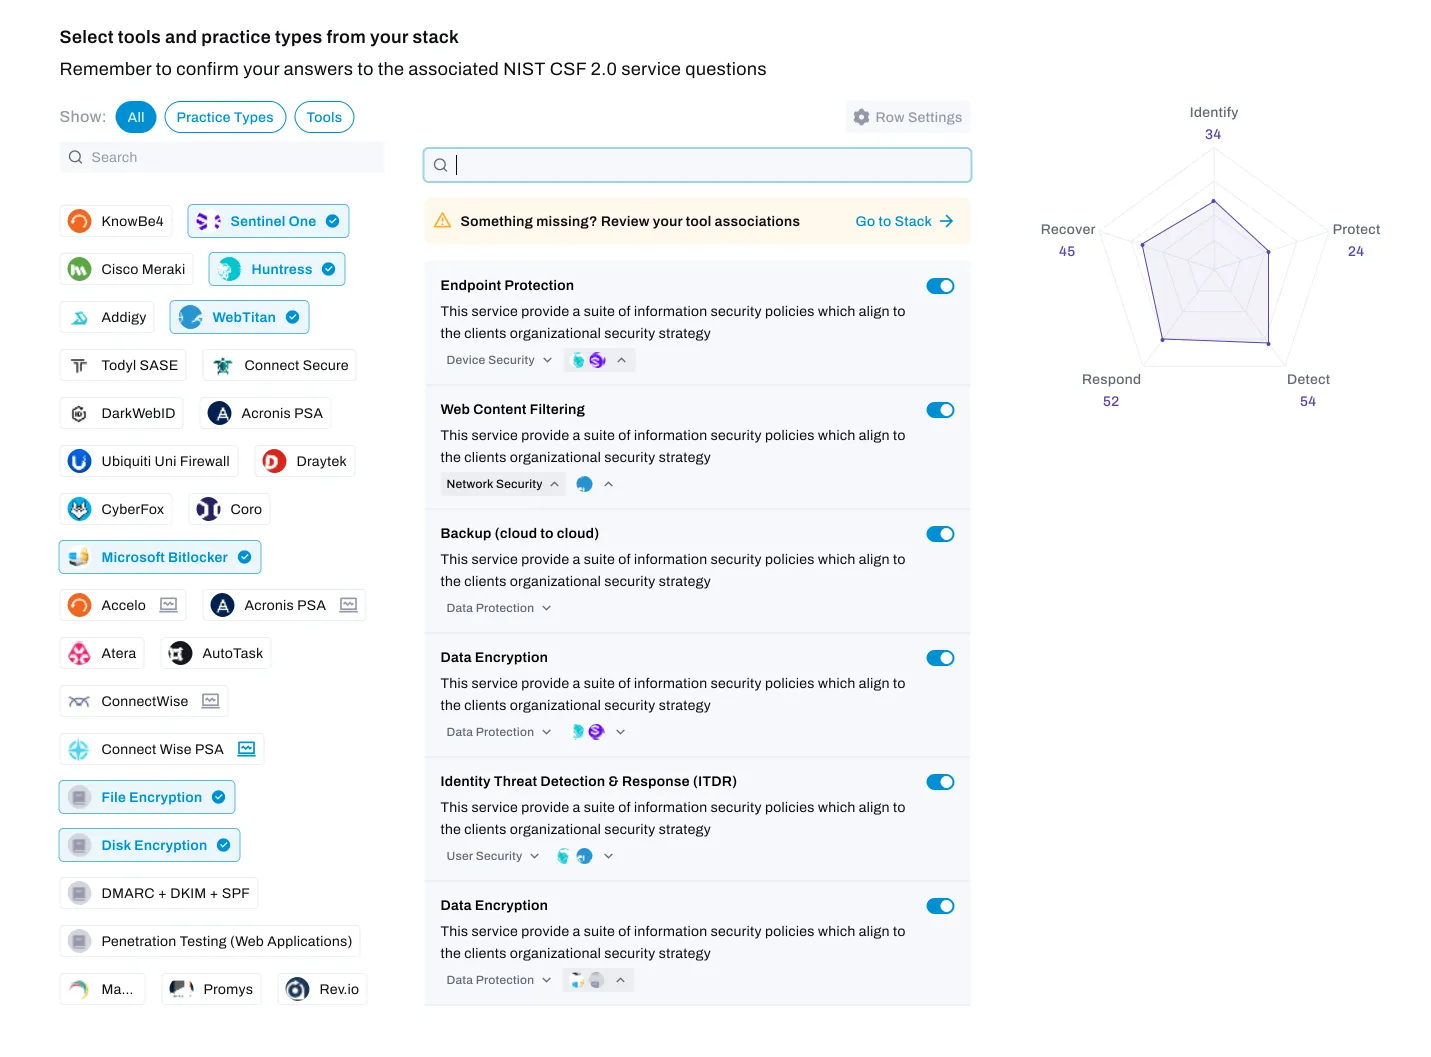
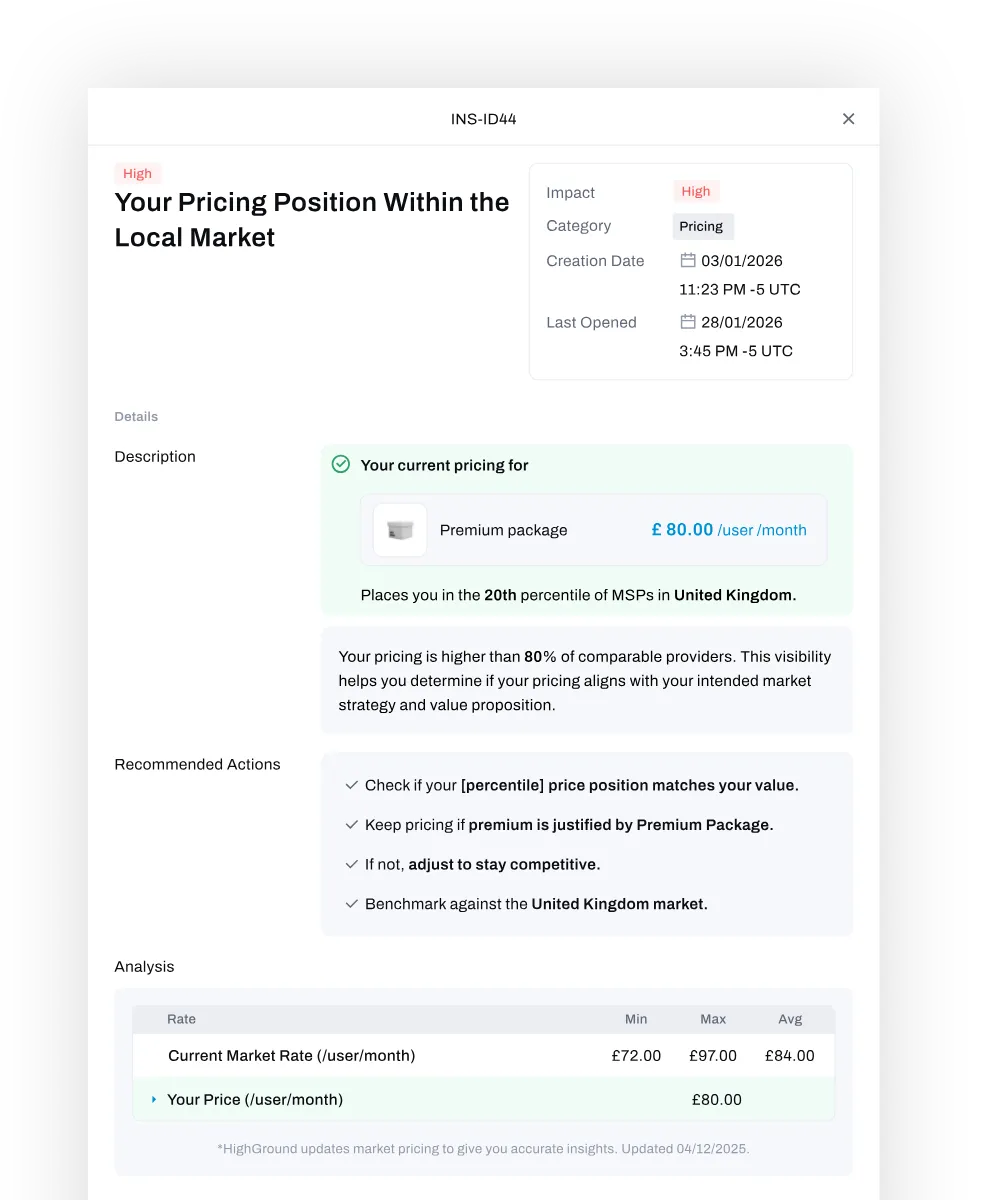
Connect risk directly to structured security packages.

Risk Made Easy

Show exactly where risk lives across users, devices, and services.

Approval Without Friction

Make the decision simple. Remove friction. Move faster.

CLIENT-READY SECURITY REPORTS

Board-ready.
Revenue focused.

Turn messy security data into clear, executive decisions - without building reports manually.
What the Board Actually Sees
01
Where the Real Risk Hides
02
The Upgrade That Gets Approved
03
User interface for selecting cybersecurity tools and practice types with toggles for services like Endpoint Protection, Web Content Filtering, Backup, Data Encryption, and Identity Threat Detection, plus a radar chart showing metrics for Identify, Protect, Detect, Respond, and Recover.
PACKAGE BUILDER

Standardised.
Built to sell.

Design structured Managed IT and Security packages that reflect how modern MSPs operate - and make them easier for clients to understand, compare, and approve.
Build What You Actually Deliver
01
Price Instantly. No Rebuilding.
02
Sell Structure, Not Line Items
03

Price isn’t the problem.Positioning is.

SMART PROPOSALS

Close faster.
Keep the momentum.

Generate fully priced, structured proposals in minutes -
using the packages and client data you’ve already built.
No rebuilding. No delays.
From Conversation to Contract
01
Show the Before and After
02
Send It While It’s Hot
03
Dashboard showing Ultimate Business Care pricing at £1500/month with details on package pricing, security capabilities, a radar chart of security posture, and projected cyber resilience and score metrics.
CASE STUDY RESULTS

Clarity converts.
Here’s the proof.

When positioning improves, revenue follows.

2.5
x

Average increase in client cyber spend

22→
6

Security sales cycle reduced from 22 to 6 days

£
300
k

Additional annual recurring revenue generated

20
mins

From conversation to proposal

Technology Spend table showing various categories with amounts in British Pounds, including Cyber Security £2,921, IT Support £1,921, and Software £2,483, alongside a circular chart indicating 0.32% spend for Cyber Security out of a total £936,952 for the current year.
TECHNOLOGY SPEND

Turn Spend Into
Revenue Insight.

Show exactly how budget is distributed across security, support, cloud and subscriptions.When spend is clear, upsell becomes logical - not forced.
Structured Spend View
01
Cost vs Capability Clarity
02
Margin Opportunity
03
STACK OPTIMISATION

Simplify the stack.
Unlock the margin.

Your tools power your MSP - but over time, they spread. More vendors. More overlap. More contracts. Complexity quietly erodes margin.
See What Tools You Have in Your Stack
01
Stop Paying Too Much For Your Tools
02
Tools Included in Your Packages
03
Quickbooks dashboard showing stack insights with potential savings of £4,200 per month and details on tools, gaps, overlaps, and consolidation in a software toolset summary.
Icon of a person at the center connected to communication symbols: email, Wi-Fi, phone, and internet globe.
Pricing report showing high impact category for Premium package at £80.00 per user per month in United Kingdom, with recommended actions and market rate analysis.
Dashboard showing a high-spending client with weak cybersecurity posture, including impact level high, technology spend of £82,000, protection score 10, resilience score 85%, recommended security actions, and a note for evaluation.
INSIGHTS

Clear direction.
No noise.

You don’t need more advice. You need to know what to fix. HighGround surfaces actionable insights across your stack, pricing, packages, and clients - so you can move with confidence.
See Where Your Budget Is Going
01
Prioritise What Matters
02
Act With Confidence
03
CORE VALUE

Turn security into
predictable revenue.

Offices
20
Outline map showing the northern parts of North America including Alaska, Canada, Greenland, and the Arctic Islands.
example of MSP security report with structured client insights
Talented Professionals
200
+
Outline map showing the countries of Central and South America with parts of North America and Africa visible.
Partners
100
+
Continents
5
Outline map showing parts of eastern Africa, the Middle East, South Asia, Southeast Asia, and Oceania including Australia and surrounding islands.
FAQ

Questions before you scale?

01
Is HighGround just a reporting tool?
02
Do I need to change my existing PSA or tools?
03
How long does it take to create a proposal?
04
Can I include third-party vendors and existing client spend?
05
Is this suitable for smaller MSPs or only larger ones?
06
How does HighGround improve profitability?
FINAL STEP

Ready to Turn Security Into Predictable Revenue?

See how HighGround helps MSPs increase security MRR and margin clarity.

Donut chart showing 7.50% spend by category labeled Cyber Security out of a total £25,450.92.Two dashboard widgets: one showing a Cyber Score of 28 with a red and gray gauge, and another showing spend by categories totaling £5,222.50 with a blue and green donut chart.